vRealize Automation 8 Health Check Failing
In this scenario you are likely to see below messages:
- Ensure vRealize Automation nodes are healthy before upgrade
- All vRealize Automation nodes should be healthy before upgrade
- CMDOUT (make: *** [/opt/health/Makefile:67: disk-usage] Error
- CMDOUT (make: *** [/opt/health/Makefile:60: node-name] Error
- CMDOUT (make: *** [/opt/health/Makefile:83: podnet-up] Error
- CMDOUT (make: *** [/opt/health/Makefile:77: k8s-up] Error
The Problem
A failing vRA health check will typically manifest in one of two ways:
- It will cause a bad response(500 internal server error) to be returned at the monitoring url (http://vRAFQDN:8008/health) causing your loadbalancer of choice to mark the offending vRA node as down, thus preventing any traffic from being passed to it. This is of course provided you have configured your load balancer health monitor as per the VMware best practise
See example of a good 200 OK monitoring url response below:
wget http://<vRAFQDN>:8008/health
- It will also cause the upgrade pre-checker to flag a failure on the vRA nodes health advising you to ensure that VRA nodes are healthy. In the next paragraph I will advise you on the specifics of how to achieve that.
So what's happening under the hood
The Lb health-check and upgrade pre-assessment are both dependent on the vRA health check succeeding, that is to say the successful execution of the script stored under /opt/health/run.sh
This script checks a number of metrics, disk usage, memory usage, status of Kubernetes and various other vRA related service. The precise details of the checks can be viewed in file /opt/health/Makefile
How to resolve
If you find yourself in a scenario where pre-upgrade is failing on vRA health or the monitoring address on a vRA appliance is returning a 500 internal server error, the best thing to do first is to SSH to vRA appliance and call the script manually. Any failures will be flagged in the output under the relevant section. See successful execution below:
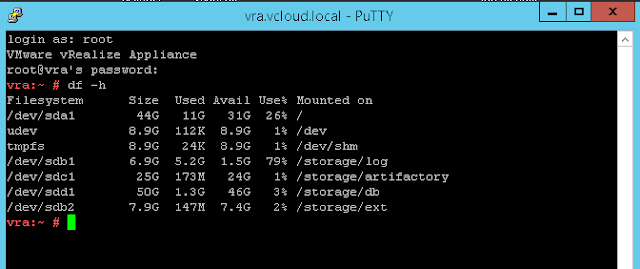
More often than not it will flag the disk check which checks whether any of the partitions are above 80%, vRA will be completely healthy in this scenario despite the result of this check and resulting failures.
To resolve this you can add additional space by following the procedure in the official vRA documentation or alternatively you can look to delete some older logfiles. Change directory to /var/log/service-logs to check the biggest offenders:
cd /var/log/services-logs/
du -h /var/log | sort -nr | head -10
The above command will show the 10 largest files or directories under services-logs.
All the compressed (.xz) log files under /var/log/services/prelude/<ServiceName>/file-logs are safe to remove. They will be appended with a date & time stamp for auditing and troubleshooting purposing best to try keep at least a months worth of logs and only consider removing files older than this. Once partition has been reduced below 80% use health script can be called again and you can then retry the upgrade assessment or check LB node status again.
If it's the data partition itself /dev/mapper/data_vg-data consuming the space (contents of embedded postgres database) you can perform below to query further.
- To connect to postgres instance(Type yes when prompted):
vracli dev psql
- To sort by largest space consumers in human-readable format run:
SELECT pg_database.datname as "database_name", pg_database_size(pg_database.datname)/1024/1024 AS size_in_mb FROM pg_database ORDER by size_in_mb DESC;
There is also a bug covered in VMware KB article 86324 affecting the vRA 8.6.0 release that can prevent logs from being automatically being purged and filling /var/log but this is resolved in the 8.6.2 release.
Hope you found this of some use.


Comments
Post a Comment